
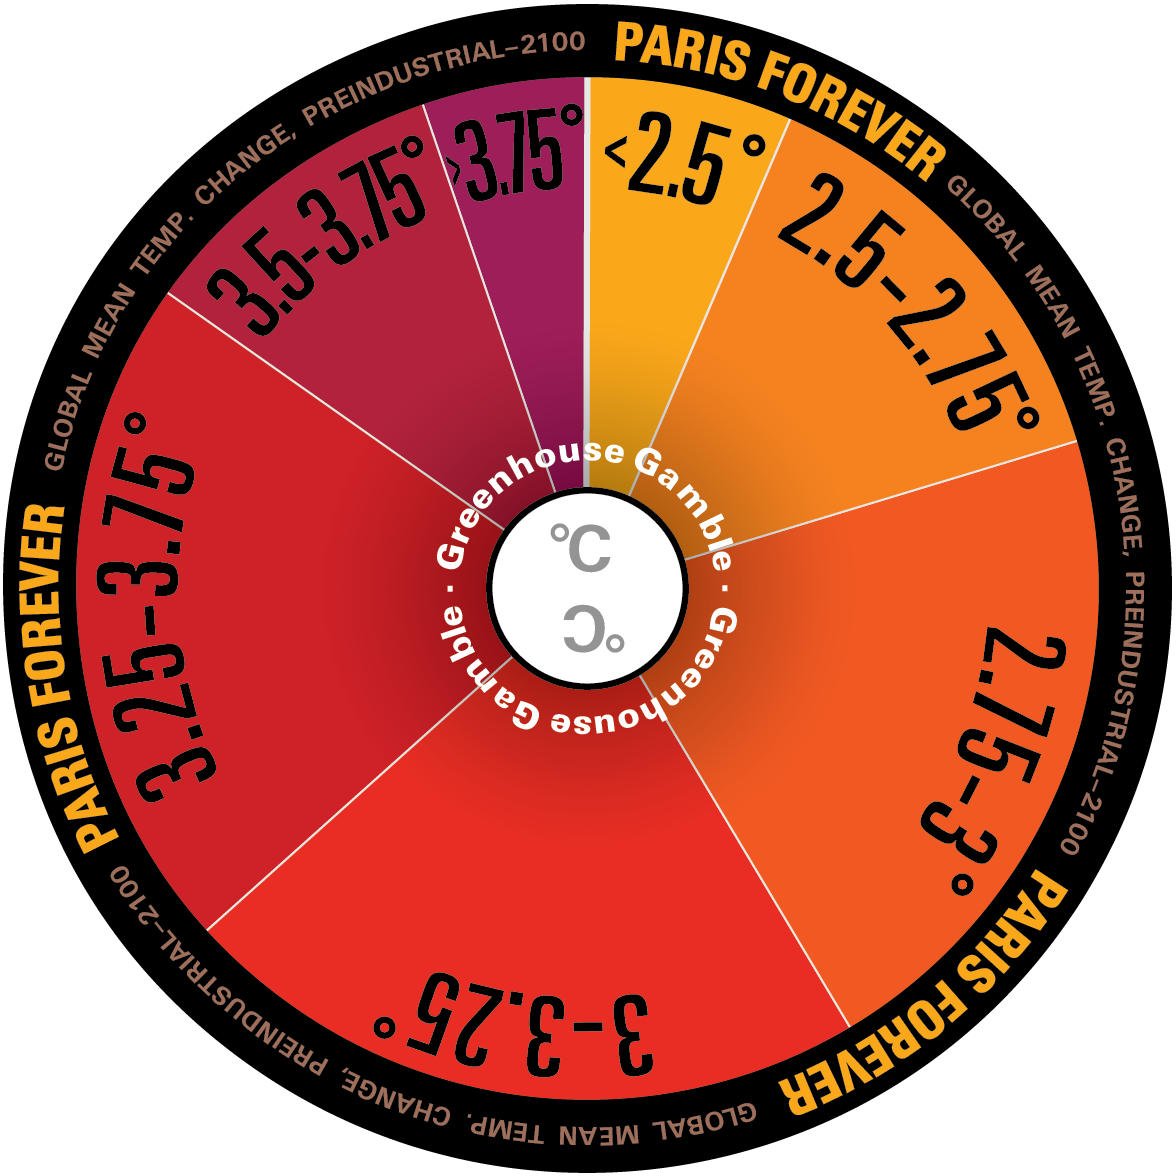
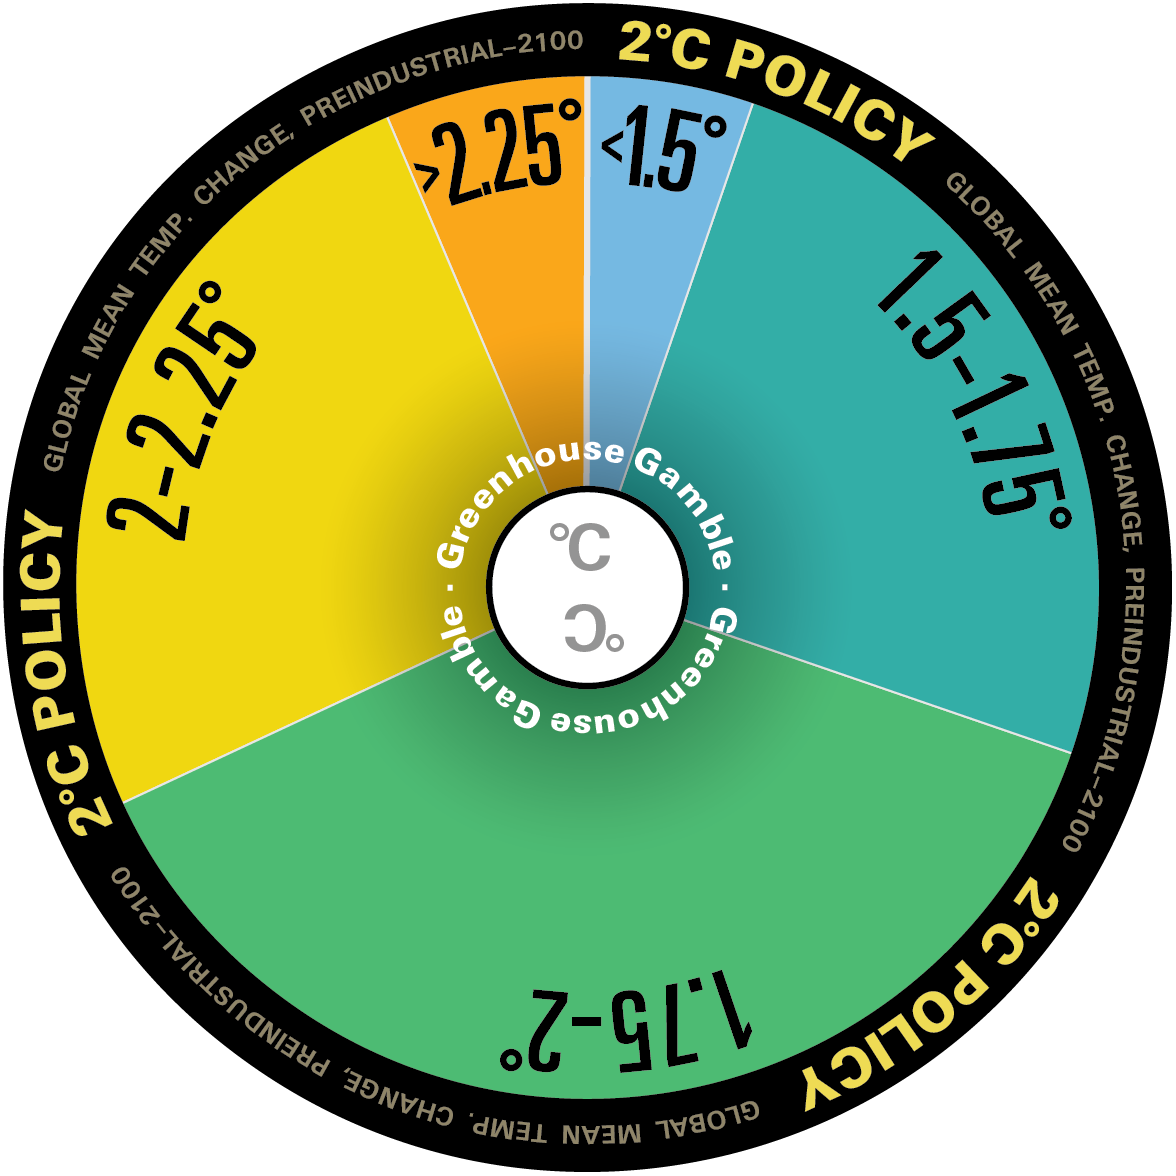
We developed the Greenhouse Gamble™ wheels to convey uncertainty in climate change prediction, which is driven by uncertainty in both the human system (e.g. economic and population growth, energy use, emissions, etc.) and the Earth system (e.g. the climate’s response to emissions). The roulette-style spinning wheels show the estimated probability of potential change in global average surface temperature at the end of the century (2091-2100) compared to pre-industrial levels (1861-1880). Each wheel represents a different set of greenhouse gas policies, and the relative area that each colored slice occupies within the wheel shows the likelihood of temperature change in that range.


Spin the Greenhouse Gamble wheels
Extreme temperature outcomes under four policy scenarios
These wheels illustrate that one of the main objectives of climate policy is to lower (or eliminate) the likelihood of extreme temperature outcomes.
The scenarios behind each wheel are described below:
|
Scenario |
Description |
Median Global Temperature Outcome a |
|
No Paris Accord |
No Paris Agreement targets, but expansion of renewables policies |
3.5°C |
|
Paris Accord |
Paris Nationally Determined Contribution (NDC) targets are met by all countries by 2030 and retained thereafter |
3.1°C |
|
2°C Policy |
Paris NDC targets are met by all countries by 2030, after which there is an emissions cap, implemented with a global emissions price, ensuring 2100 global surface mean temperature does not exceed 2°C above pre-industrial levels with a 66% probability |
1.9°C |
|
1.5°C Policy |
Paris NDC targets are met by all countries by 2030, after which there is an emissions cap, implemented with a global emissions price, ensuring 2100 global surface mean temperature does not exceed 1.5°C above pre-industrial levels with a 50% probability |
1.5°C |
a Average global surface air temperature in 2091-2100 relative to 1861-1880. There are even odds of a result falling either above or below the median temperature level.
The table below, which shows the percentage of our model runs that exceed a given temperature for each policy scenario, also reveals how increased climate policy ambition translates into decreased likelihood of extreme temperature outcomes. We see that even relatively modest policies can significantly reduce the likelihood of high temperature outcomes. For example, the Paris Accord scenario has modest emissions reductions relative to the No Paris Accord scenario, yet greatly reduces the chance of temperature changes above 4°C (decreasing it from 14% to <0.25%). The 2°C Policy scenario essentially bounds temperature to 2.5°C, with less than 0.25% of runs exceeding that level. The 1.5°C Policy scenario essentially bounds temperature to 2°C, with less than 0.25% of runs exceeding that level. Also important are the lower tails of the temperature change distributions. Under the No Paris Accord and Paris Accord scenarios, the 2°C temperature target is essentially out of reach.
|
% of Model Runs Exceeding Temperature |
||||
| Temperature (°C) |
No Paris Accord |
Paris Accord |
2°C Policy |
1.5°C Policy |
|
1.5 |
100% |
100% |
95% |
50% |
|
2 |
100% |
100% |
33% |
<0.25% |
|
2.5 |
99% |
94% |
<0.25% |
... |
|
3 |
86% |
59% |
… |
… |
|
3.5 |
50% |
15% |
… |
… |
|
4 |
14% |
<0.25% |
… |
… |
|
4.5 |
1% |
… |
… |
… |
Note: As each ensemble included 400 runs, the lowest percentage of runs resolved is 0.25% (1 out of 400). If none of the runs in the ensemble meet a criteria, we assume the percentage to be <0.25% rather than 0% as there is still a chance that the tail outcomes could extend beyond the values produced here if more than 400 ensemble members were used.
If nations fulfill their Paris Agreement commitments and do nothing further, humankind will be spinning the “Paris Accord" roulette wheel. However, if nations enact coordinated policies to reduce future emissions to be consistent with long-term temperature goals, we will get to spin one of the other policy wheels, which gives us significantly increased chances of constraining global temperature change to below 2.5°C or 2°C in 2100.
The Science behind the Wheels
The wheels are based on the following paper: Morris, J., A. Sokolov, A. Libardoni, C. Forest, S. Paltsev, J. Reilly, A. Schlosser, R. Prinn and H. Jacoby (2021), A Consistent Framework for Uncertainty in Coupled Human-Earth System Models, Joint Program Report 349.
Greenhouse Gamble Wheels: Our Modeling Approach
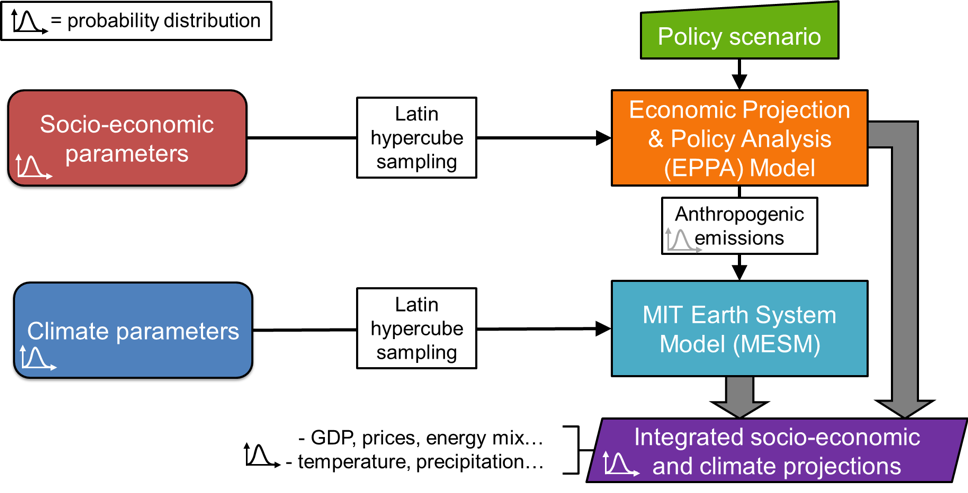
We use the MIT Integrated Global System Modeling (IGSM) Framework, which is designed to analyze interactions between humans and the Earth system. The IGSM framework consists primarily of two interacting components—the Economic Projection and Policy Analysis (EPPA) model and the MIT Earth System model (MESM). The EPPA model projects future economic growth, energy transitions and emissions of greenhouse gases and air pollutants from human activity. MESM then projects the environmental conditions that result from human activity and resultant emissions. By linking these models, IGSM allows for the projection of future emissions and their global temperature implications.
Of course, there is uncertainty in both the human (socioeconomic) and climate dimensions of the modeling framework. To capture these uncertainties, we employ Monte Carlo uncertainty analysis. The basic steps are: (1) identify uncertain input parameters and develop probability distributions for them, (2) sample from the distributions to construct multiple sets of parameter values, and (3) simulate large ensembles of model runs using the sampled parameter values. The distribution of model outcomes from the ensemble of simulations provides estimates of future states and their uncertainty. The figure below depicts this approach for representing uncertainty in the MIT IGSM, creating probabilistic, integrated socio-economic and climate projections.
The development of probability distributions for socioeconomic parameters is described in Morris et al., (2021) and for Earth system parameters in Libardoni et al., (2019, 2018a,b). Estimated distributions for socioeconomic parameters were based on statistical estimates using historical data where possible (e.g. GDP growth, autonomous energy efficiency improvement, rate of technology penetration), published estimates of uncertainty (e.g. population, fossil resource availability), literature results and expert judgement (e.g. future technology costs, elasticities of substitution, urban pollutant initial inventories and trends, capital vintaging). For uncertain Earth system parameters, historical data was used to develop a joint distribution of parameters representing climate sensitivity, ocean heat uptake and aerosol radiative forcing. We employ Latin Hypercube sampling and simulate 400-member ensembles for each scenario.